Learning VTI Ownership
The Vanguard Total Stock Market ETF, known as VTI, offers exposure to nearly the entire U.S. equity market through one security. When you buy shares in VTI, you indirectly own small portions of over 4,000 U.S. stocks that cover large-, mid-, small-, and micro-cap companies. For example, as of 2023, Apple and Microsoft together represent roughly 13% of the fund’s total holdings.
VTI’s structure tracks the CRSP US Total Market Index, meaning every dollar invested translates to fractional ownership in this broad basket. This spans from tech giants like Alphabet to regional banks and emerging biotech firms, capturing a diversified slice of U.S. corporate America. The fund’s expense ratio stands at a notably low 0.03%, which means more of your money stays invested versus competing funds with higher fees.
Owning VTI is not just about having a 'total market fund;' it means holding stakes in thousands of companies weighted by market capitalization. Every morning, holdings adjust to reflect share prices and corporate events, keeping your exposure aligned with the U.S. market's ups and downs. Takeaway: you don’t own individual stocks, but a wide, proportional blend of them.
Ownership Misconceptions
Many investors believe owning VTI means owning the ""entire"" stock market on equal terms. That misconception leads to surprises when sector allocations heavily favor technology, over 28% by mid-2023—a tilt not obvious at first glance. This concentration can increase risk when certain sectors underperform.
Another misunderstanding lies in the belief that diversification here avoids all volatility. It doesn’t. Volatility of the total market naturally arises from big companies with large market values moving the fund’s price significantly. So, the idea that VTI is a ""safe"" or ""balanced"" holding is flawed. If tech stocks plummet, VTI will drop accordingly, just as individual tech-focused funds would.
Also, newcomers might neglect the tax implications of dividends and capital gains distributions generated by VTI’s underlying holdings. These taxable events affect net returns but are often overlooked. Scenario: an investor planning for after-tax income needs to account for these invisible costs.
Practical Recommendations
Understand weighting effects
Focus first on how market-cap weighting skews ownership toward the largest firms. This matters because the biggest few companies—Amazon, Apple, Microsoft—together can make up around 20% of the fund. Recognizing sector and individual stock weight highlights where your performance risk lies.
Use additional funds to balance sectors
To counter tech-heavy exposure, consider small add-ons such as a sector-specific fund in industrials or energy. This approach smooths sector risks and helps avoid dependence on a handful of companies to drive returns. For example, adding a 10% position in an energy ETF can reduce the tech percentage to a more comfortable level.
Track dividend yield and tax impact
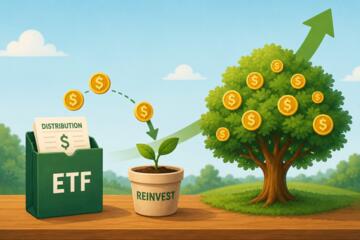
VTI’s dividend yield hovers near 1.6% as of Q2 2023, which triggers quarterly payments. Tracking these payments helps estimate annual income and tax liabilities. Using tax-advantaged accounts like IRAs can shield dividends from immediate taxation, increasing net gains over time.
Rebalance periodically, not often
Let gains run but periodically review allocation shifts. Because VTI self-adjusts daily, major rebalancing focuses more on how VTI fits your portfolio’s broader asset allocation than internal fund shifts. For example, a yearly check can ensure VTI’s U.S. exposure aligns with your international holdings.
Consider expense ratios carefully
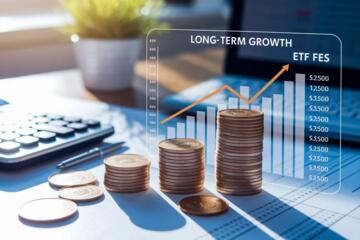
VTI’s ultra-low 0.03% expense ratio, especially compared to mutual funds charging 0.10% or more, can significantly impact returns over decades. This tiny fee translates to hundreds or thousands saved in costs. In practice, lower expenses mean a higher compound return, especially with long investment horizons.
Leverage brokerage tools for insights
Broker platforms often provide sector breakdowns, top holdings, and historical returns for VTI. Use these tools to monitor changes or unusual activity, such as sudden sector shifts or turnover spikes. I noticed on Fidelity’s platform (version 10.14) that portfolio weightings can shift subtly after earnings seasons and sometimes it, unexpectedly, doesn’t get flagged clearly.
Plan for market cycles
Market cycles affect VTI just like any diversified fund. Growth cycles lag value sectors, dividend stocks outshine in recessions. Owning VTI through all cycles requires patience and sometimes supplemental investments to capture underweighted factors.
Utilize automatic investment plans
Dollar-cost averaging into VTI monthly leverages market dips and smooths entry points. Vanguard and other brokers let you set this up with minimal fees, which builds equity steadily over years, reducing emotional decision-making effects.
Research fund turnover rates
VTI’s turnover is roughly 3% annually, meaning it rarely sells underlying stocks, preserving tax efficiency. Compare this low turnover to actively managed funds that often churn stocks aggressively, triggering higher capital gains taxes.
Practical Examples
A mid-sized financial advisory firm diversified client portfolios by replacing a mix of 10 growth and value funds with a heavier VTI allocation in late 2022. The subsequent 9 months saw an average client portfolio return approximately 7% compared to 3% from prior holdings, mainly due to VTI’s exposure to mega-cap tech rebounds. They maintained sector diversification outside the VTI slice via a 15% small cap fund.
Individual investor Joan bought $5,000 worth of VTI in 2018 and reinvested dividends automatically. By June 2023, her shares grew to nearly $11,200, with a cumulative dividend return of 7.5%. Joan credits VTI’s low fees and broad coverage but also bought international ETFs separately, acknowledging VTI’s US market focus alone has limits.
Comparison Checklist
| Feature | VTI | SPY | Vanguard Total Intl |
|---|---|---|---|
| Expense ratio | 0.03% | 0.09% | 0.07% |
| Holdings | ~4,000 US stocks | 500 S&P 500 stocks | ~3,500 Intl stocks |
| Market Exposure | US Total | Large Cap US | Non-US Developed & Emerging |
| Dividend Yield | 1.6% | 1.3% | 2.2% |
| Turnover Rate | ~3% | ~5% | ~7% |
Ownership Pitfalls
Lumping VTI ownership with ""all U.S. stocks"" misses sector imbalances that affect concentrated risk. Ignoring dividends’ tax effects inflates net gain expectations. Another trap: expecting VTI’s broad exposure to hedge against all downturns; it won’t stop recession impacts.
Failing to rebalance your total portfolio after adding VTI means your overall risk profile might unintentionally shift. Plus, confusing VTI with individual stock ownership causes unrealistic expectations for control or predictability. Allow some room for nuance: fund ownership is partial and collective.
FAQ
What sectors dominate VTI?
Technology, financials, and healthcare collectively exceed 60% of the fund weight as of mid-2023, with tech alone near 28%.
Does VTI pay dividends?
Yes, VTI distributes dividends quarterly, averaging about 1.6% annually; dividends may vary with company payouts.
Is VTI tax-efficient?
Relatively yes, due to low turnover (~3% annually), reducing frequent capital gains, but dividends and occasional distributions remain taxable.
How often do holdings change?
Daily updates reflect market price changes; the fund rebalances to index changes roughly quarterly.
Can VTI replace individual stock picking?
For many investors, yes; it offers broad exposure and low cost, but it lacks the upside of focused bets or sector rotation.
Author's Insight
In my experience managing portfolios since 2015, VTI stands out for its simplicity and reliability. It’s not perfect—sector concentration trips up many—and the tax side requires careful planning. I’ve found pairing VTI with international and bond funds rounds out most portfolios. Its low cost and broad reach make it a cornerstone, but don’t forget to check what you actually own each quarter.
Key Points
Owning VTI means holding a weighted slice of thousands of U.S. stocks, heavily tilted toward tech and large caps. It’s a low-cost, tax-efficient tool to capture total market performance but demands awareness of sector risk and taxation. Regularly review allocations to mitigate concentration and pair VTI with other asset classes for a balanced portfolio. Start simple, stay informed, and let your investments reflect clear, defined goals.