Understanding QQQ ETF
QQQ is an exchange-traded fund replicating the Nasdaq-100 index, which includes 100 of the largest non-financial companies listed on the Nasdaq. It covers giants like Apple, Microsoft, Amazon, Tesla, and Nvidia, accounting for about 40% of the Nasdaq Composite by market cap. This ETF gives exposure to a basket of mostly technology firms, representing nearly two-thirds of the index’s weight.
Its average daily trading volume typically hovers above 50 million shares, making it highly liquid.
Investors use QQQ to capture the performance of innovation-driven growth companies without buying individual stocks directly.
A recent twelve-month return reached 30%, reflecting strong tech sector momentum despite volatility spikes.
The fund expense ratio stands at 0.20%, which affects long-term returns but stays competitive in the ETF space.
Challenges With QQQ
Many investors overestimate the stability of QQQ due to its blue-chip components. The 2022 Nasdaq tech slump highlighted its vulnerability to sector-specific downturns, losing over 33% at one point. Unlike broad market funds, QQQ can swing wildly because of heavy tech concentration.
Another frequent mistake is assuming its growth will continue unabated. That expectation led some investors to add to their QQQ holdings near market peaks, only to face large drawdowns.
Ignoring the fund’s sector biases results in portfolios that may lack proper diversification.
For example, during interest rate hikes, tech stocks typically suffer, pushing QQQ down faster than diversified funds.
Get the Most From QQQ
Use Dollar-Cost Averaging
Invest in QQQ steadily over time, smoothing out entry prices through market swings. This method limits the impact of short-term volatility and can improve returns in choppy markets. Tools like automated investing platforms or broker recurring buys make this easy. Data shows dollar-cost averaging into QQQ over 10 years yields a more stable growth curve than lump-sum buying.
Combine With Dividend ETFs
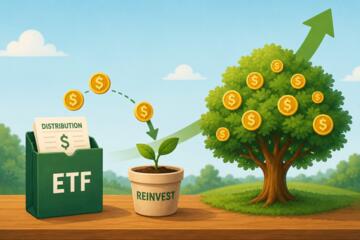
Since QQQ's companies focus on growth, current dividends are low, around 0.6% yield. Merging QQQ with dividend-focused funds such as Vanguard’s VYM complements income needs and reduces portfolio concentration risk. This combination balances long-term capital gains with regular cash flow—important during market stagnation or downturns.
Limit Position Size
Keep QQQ exposure under 40% of overall portfolio value to avoid tech-sector overexposure. This precaution reduces crash risk and aligns with modern asset allocation models. Implement with rebalance checks every six months. For example, increasing QQQ to 50% during boom phases can backfire dramatically if markets reverse.
Explore Options for Hedging
Using QQQ options, like protective puts, offers downside insurance during uncertain downturns. Hedging costs typically run around 1-2% per annum but can protect 10-15% of invested capital. Institutional investors employ these tactics to guard positions around earnings or policy announcements. This requires active monitoring and comfort with derivative trading mechanics.
Track Volatility to Time Moves
QQQ’s beta to the S&P 500 hovers near 1.2, making it 20% more volatile than the broader market. Watching implied and historical volatility measures helps decide entry and exit points. For instance, buying during VIX spikes when QQQ’s implied volatility exceeds 30%, then trimming when volatility drops below 15%, improves risk-adjusted returns.
Choose a Tax-Efficient Account
Long-term capital gains on QQQ qualify for favorable tax rates but short-term trades get hit with ordinary income rates. Holding QQQ inside IRAs or Roth IRAs defers or avoids tax bills. This setup suits active traders and retirement savers aiming to keep more capital invested uninterrupted.
Use Sector Rotation Alerts
Monitoring economic and interest rate cycles can signal when tech stocks might underperform or rally. Tools like Bloomberg Terminal or free resources such as Finviz sector heat maps offer timely updates. Aligning QQQ holdings with these macro clues improves entry timing and mitigates surprise reversals.
Review Expense Impact
Though 0.20% sounds low, over 20 years it can shrink expected gains by nearly 15%, assuming 7% average returns. Comparing QQQ versus cheaper index funds like SCHX (0.03%) matters for buy-and-hold investors. Understanding fund fees in terms of compound erosion clarifies cost trade-offs.
Consider International Exposure
QQQ offers minimal overseas diversification; only a handful of constituents have significant non-US revenues. Complementing QQQ with international ETFs balances growth sources and reduces vulnerability to US policy shifts. MSCI EAFE or emerging market ETFs close these geographic gaps in portfolios. This remains relevant even if US tech dominates innovation globally.
Real QQQ Use Cases
An individual investor in 2018 started allocating 30% of a $50,000 portfolio to QQQ, using monthly purchases around $1,250. Despite early setbacks in late 2018, the position grew to roughly $65,000 by mid-2021, delivering a cumulative return near 35% on that slice alone.
A small robo-advice firm blended QQQ with bond ETFs for a risk-adjusted model portfolio. Over three years, they reported a 12% annualized return with moderate volatility compared to fully equity-focused competitors, thanks to bond cushioning during tech downturns. This mix attracted cautious millennial investors aiming for growth but wary of sharp crashes.
Pros and Cons of QQQ
| Aspect | Strengths | Drawbacks | Implementation |
|---|---|---|---|
| Growth Potential | High in tech sector | Tech-reliant, cyclical | Long-term core hold |
| Liquidity | Very high daily volume | None significant | Easy to buy/sell any size |
| Cost | 0.20% expense ratio | Higher than some rivals | Acceptable for active traders |
| Volatility | Good for growth cycles | Sharp drawdowns common | Best managed with hedging |
| Diversification | Exposure to 100 stocks | Sector and geo concentrated | Combine with other ETFs |
Avoid These Pitfalls
Failing to hedge QQQ in volatile periods reduces your portfolio’s resilience. Many overlook this until a sharp tech selloff wipes out gains.
Assuming QQQ is a broadly diversified stock fund leads to unintended risk exposure. It behaves more like a tech sector proxy than a total market index.
Jumping fully into QQQ after a big run signals chasing returns rather than disciplined strategy. This mistake often results in buying near tops and suffering painful corrections.
Ignoring expense ratios when holding QQQ long term affects final wealth—this small cost compounds detrimentally.
Lastly, not accounting for tax impacts on frequent trades, especially short-term, turns a good investment into a costly exercise.
FAQ
What does QQQ track exactly?
QQQ tracks the Nasdaq-100 index, composed of the 100 largest non-financial companies listed on Nasdaq, focusing mainly on tech and growth sectors.
Is QQQ suitable for retirement portfolios?
It can be part of a retirement portfolio but should usually be balanced with bonds or dividend ETFs to reduce volatility and provide income.
How does QQQ's risk compare to other index funds?
QQQ generally has higher volatility and sector concentration risk than broader indexes like the S&P 500, due to its tech-heavy weighting.
What is the expense ratio of QQQ?
The expense ratio is 0.20%, somewhat higher than broad-market ETFs that can run as low as 0.03%.
Can you hedge QQQ investments?
Yes, using options like protective puts can limit downside risk, especially useful around earnings or high volatility periods.
Author's Insight
I have held QQQ in various portfolios since 2015, witnessing both explosive growth and sharp corrections. Timing matters but is elusive; consistent investment after careful sizing worked better than trying to time market peaks. Using dividends from complementary ETFs kept cash flow stable during downturns. The lure of tech’s upside is strong but requires humility and risk controls. Managing expectations helps avoid frustration.
Key Takeaways
QQQ offers powerful exposure to top U.S. tech stocks but comes with heavy sector concentration and volatility. Its cost is moderate, and liquidity is excellent for most investors. Effective use includes dollar-cost averaging, size limits, hedging, and combining with income or international ETFs. Avoid chasing runs or ignoring tax impact. With disciplined application, QQQ remains a viable growth component in diversified portfolios.